
Solar PV + Battery Storage Sizing with Geli (The Basics)
- chatengineer

- Apr 5, 2019
- 8 min read
Not sure how many engineers get the chance to design a full blown solar array with combined battery storage, but we did, and wanted to show some easy steps on how we accomplished this!
In this blog post we will go over:
Initial array sizing calculations
Navigation through an online sizing software called Geli (New to the market, but generates a useful power generation and money savings report)
A brief description of some companies Geli has partnered with: NEXtracker, Delta, etc.
How the Geli software works and why you should look into it for your configuration
Disclaimer: We do NOT work for Geli or any of the companies talked about in this blog. We are simply field engineers that do this for a living, and wanted to share a little bit about what we’ve learned along the way. This paper is prepared with combined knowledge from Geli, PG&E Pacific Energy Center and Tetra Tech Energy Solutions.
Part I: Solar Array Sizing
For the point of this exercise, you’ll need to size the solar array prior to plugging information into the Geli program. Here’s the basic calcs you’ll need:
Eq. 1: Annual Use Design (kWh) = (Annual Usage kWh)(Design %)
You should obtain (if possible) from your local utility company, 15 minute electric interval data, and download it to excel for later use (trust me). Grab the total for the year, and multiply it by (usually 0.5-0.9) a percentage of the total load you’d like to design the array for. Usually you don’t want to design for more than what you use on a daily basis, as this drives up the initial cost, thus increasing your payback period simultaneously.
Eq. 2: System Size (kW) = Annual Use (kWh/yr) / Peak Sunlight Hours (hrs/yr)
Once you have an energy range you’d like to aim for, divide it by Peak Sunlight Hours (PSH). These vary based on which region you live in, but can generally be based off of this graph:

This map comes directly from the consumers guide to renewable energy published by the DOE.
We highly recommend you take a look over this document, as there are more explanations on how to calculate energy savings, some basics on grid connections and how to select suppliers during the design process. Again, we’re going to use Geli in this case for selections, which already supplies a list of approved vendors, but you certainly aren’t stuck with only these choices.
Once you have your Peak Sunlight Hours (PSH) figured out, plug that into Equation 2 in order to get a fairly accurate assumption of how large a system you’d need. In order to obtain a DC dating, you need to multiply the answer from equation 2 (AC rating) by 1.15, or essentially a 15% increase in power (conversion factors may vary from AC to DC but this is generally a good rule of thumb).
Part II: Navigation through Geli
Why are we using Geli in the first place? Well not only can you save money and carbon by switching to solar, inducing demand peak shaving using battery storage, but you can also save money and energy by using an intelligent inverter controller (Geli node). Geli specializes in a software that allows (or really decides), when to discharge and charge the battery throughout the day. This is useful because of the new PG&E tariffs that are to be released and fully adopted by November 2020. These tariffs shifted peak demand charges to the right from 3-7pm to 4-9pm, so pretty much when most people are returning home from work. PG&E did this due to the simple fact that theres a TON of excess solar power generation during the day and not enough at night, which still doesn’t help peak demand spikes at the plant level. The only way to reduce peak demand spikes is to introduce battery storage into the system. Too much excess solar is a good problem to have, but if we generate it and don’t use/store it somewhere, then it’s all for nothing.
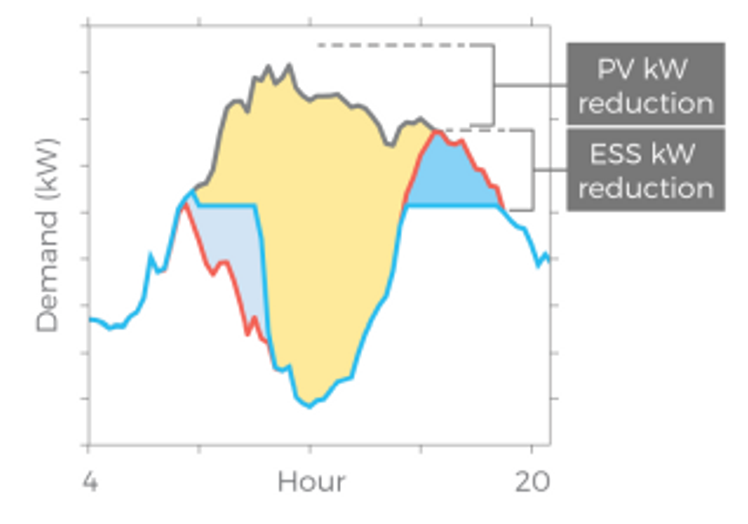
Soooo BOOM, introducing the Geli node! In a nutshell, the controller will use historical data combined with real time solar production data to determine when to charge and discharge the battery, so the maximum amount of energy savings can be obtained. Our thoughts are, it might charge throughout the morning, and discharge at night when peak demand charges are in effect. Here’s an illustration from a report produced by Geli’s online platform:

To give a brief explanation on how to navigate through the website, we’ll walk you through the basics.
A. Create an account – easy to do
B. Create a project – fill in all the appropriate information that you have. You can keep it vague, or input all project information and use this as an official bid document. It will produce energy savings and payback periods based on the rates you chose and information you’ve uploaded.
Note: when you get to the AC coupled and DC coupled checkboxes, we suggest reading into why you’d want to choose each in this article here: AC versus DC coupled systems
C. Choose your hardware – there are quite a few options to choose from, all vendors are official partners with Geli and have seen successful results when paired with the Geli node. For our sample project we chose Delta as our main battery/PV system supplier, but certainly there are more that would suffice. Read each one carefully as some are battery only suppliers.
If you’re not sure which one to choose or have any questions, each supplier has an info guide provided with a little blue information “I” icon to click on. This gives cutsheet information, company brochures and contact info should you still be confused.
D. Choose your tariffs – select your energy provider and which tariff you are currently on. You’ll notice you need to guess which tariff your building will be placed on, post installation of the PV or PV +battery storage system. Usually its safe to say, every solar building will be placed on a TOU (Time of Use) tariff due to the simple fact that solar varies throughout the day, as companies like PG&E make it easy to gage energy use and cost per kW by switching users to a TOU schedule. Reach out to your energy provider should you still need guidance here, they may be able to predict the tariff for you.
A meter number is also helpful for reporting and tracking for the Geli online application. Geli has a proprietary software algorithm that predicts usage, so the more information you can provide them, the better the analysis.
E. Upload energy data – this part is tedious, but worth your time focusing on manipulating the data so that Geli’s algorithm can interpret your building use properly. You will need to upload two sets of data, the facility interval data (left picture below), and the predicted solar production data (right picture below).
Start with the facility interval data. We used three column upload, choose what type of interval data you have (how often the readings are recorded) and what type of data is it (kW or kWh – either will do).


Do the same for uploading Solar PV Production Data, except this time, gather kWh interval data and input the capacity at which you think your PV array will be. This can be found by using a free online calculator like PVWatts or equivalent. This will give you a kW rating (make sure its DC not AC rating) for your solar array panel, so Geli can design an inverter/battery storage integrated system for you properly.
AC is usually used for household appliances, so your energy use is always in AC kWh, but DC is usually the power produced by the solar array in which you’d want equipment sizing to pertain to DC rating in this case. You can convert DC to AC and store AC in a battery (which is what we plan to do for this application), but we won’t get too deep into that topic. Just think AC stored power is usually more efficient on larger more complex buildings, and DC battery storage is usually more efficient with smaller, more simple systems (residential solar array, etc).
F. Facility Fingerprint – Once you’ve uploaded your data, Geli will process this data to produce a facility fingerprint at the bottom of the page (this may take a few minutes – so be patient). If your data wasn’t formatted properly, go back to their How To videos at the top of the page to see what you did wrong. The algorithm won’t accept any deviations from the formatting they’ve requested.
After a couple minutes, you should get a fingerprint that looks something like this:

Baseline is the amount and intensity your current energy use at your facility. Solar PV Production is based on the amount of solar radiation produced at that exact location throughout the year. And Net Load, is the difference between the two. Or basically, in this case it shows that there is enough solar produced in our area, that it will cover the baseline load for our building. Which makes this facility a great candidate for a solar PV + battery storage.
G. Energy Bill Savings – Moving on to the next page, Geli shows a nice table of energy savings produced by utilizing PV or PV + battery storage. Again, you can use Geli software to design a battery storage system only, or a solar PV array + battery storage. Both are allowed here, which will come up again soon.
This bill gives you pre and post energy cost, demand charges and peak hour rates for the tariffs you chose. This is all dependent upon the information you’ve uploaded and the rates/tariffs you’ve used, so get accurate data when conducting this design exercise.
H. System Cost and Assumptions – On this page, we left it untouched because it auto-populates based on info used beforehand, but it’s worth talking about briefly.
System Costs and Assumptions will calculate equipment costs, installation costs, tax rates, discount rates and incentives. All of which have contributed to the rule of thumb of $20/kW maintenance cost per year. Incentives have been almost completely eradicated in California due to the amount of solar being produced, so this section can be left along or deleted if you’re designing for a location in California.
I. System Selection – In this section, you’ll now choose a system based on the hardware you selected earlier in the Geli program. What you’re looking for here is a high IRR (Internal Rate of Return) which is “is a discount rate that makes the net present value (NPV) of all cash flows from a particular project equal to zero.”
You also want to see a high NPV (Net Present Value) of the system, a high $$ savings, and a low payback (total savings divided by total cost). You will have to individually click on each sizing to simulate potential savings (which may take a few minutes), but well worth the wait. Once the Geli algorithm is done running it’s calculations, Geli will highlight in yellow, the highest attribute to that design. For example, below it shows that the delta 317 kWh system is highest in NPV and IRR, but the one below it (Delta 529 kWh) is highest in Savings. Get the gist?
So sometimes, a client has restrictions on payback years, lets put 4 year max for that for example, you wouldn’t want to choose the 529 kWh selection for this, due to the simple fact that the customer can’t award contracts to any projects with a payback period of over 4 years.

Select the one that best suits your needs and the design of the system the best.
J. Generate your report! You can choose which type of report you want (PDF, etc.), and Geli will put together an aesthetically pleasing report, ready to pitch to your customer and head out to contracting for bid.
Part III: Geli’s Partners
Geli has partnered with a few (what we consider) top tier suppliers in the energy/utility supplier industry, in which are easy to choose from through the online application, and easy to obtain quotes for.
Geli has both:
Residential Products
Tabuchi Electric – EIBS (Eco Intelligent Battery System)
Commercial & Industrial Products
Delta
Lockheed Martin
Nextracker
Sungrow
Samsung
Energport
Princeton Power Systems
Dynapower Company
Part IV: Helpful Graphics
Below are some helpful graphics for understanding PV + battery storage systems and how they are able to tie into the utility grid (all of which are taken from other websites as simply as references):


Comments